# Load required packages
pacman::p_load(readxl, gifski, gapminder,
plotly, gganimate, tidyverse)Animated Statistical Graphics with R
Setup
Importing the Data
# Define the columns to convert to factor
col <- c("Country", "Continent")
# Read the Excel file and wrangle the data
globalPop <- read_xls("/Users/sharon/OneDrive - Singapore Management University/isss608data/hands-on_exercise3/GlobalPopulation.xls",
sheet = "Data") %>%
mutate(across(all_of(col), as.factor)) %>%
mutate(Year = as.integer(Year))Static Bubble Plot with ggplot2
# Create a static bubble plot
ggplot(globalPop, aes(x = Old, y = Young,
size = Population,
colour = Country)) +
geom_point(alpha = 0.7, show.legend = FALSE) +
scale_colour_manual(values = country_colors) +
scale_size(range = c(2, 12)) +
labs(title = 'Year: {frame_time}',
x = '% Aged',
y = '% Young')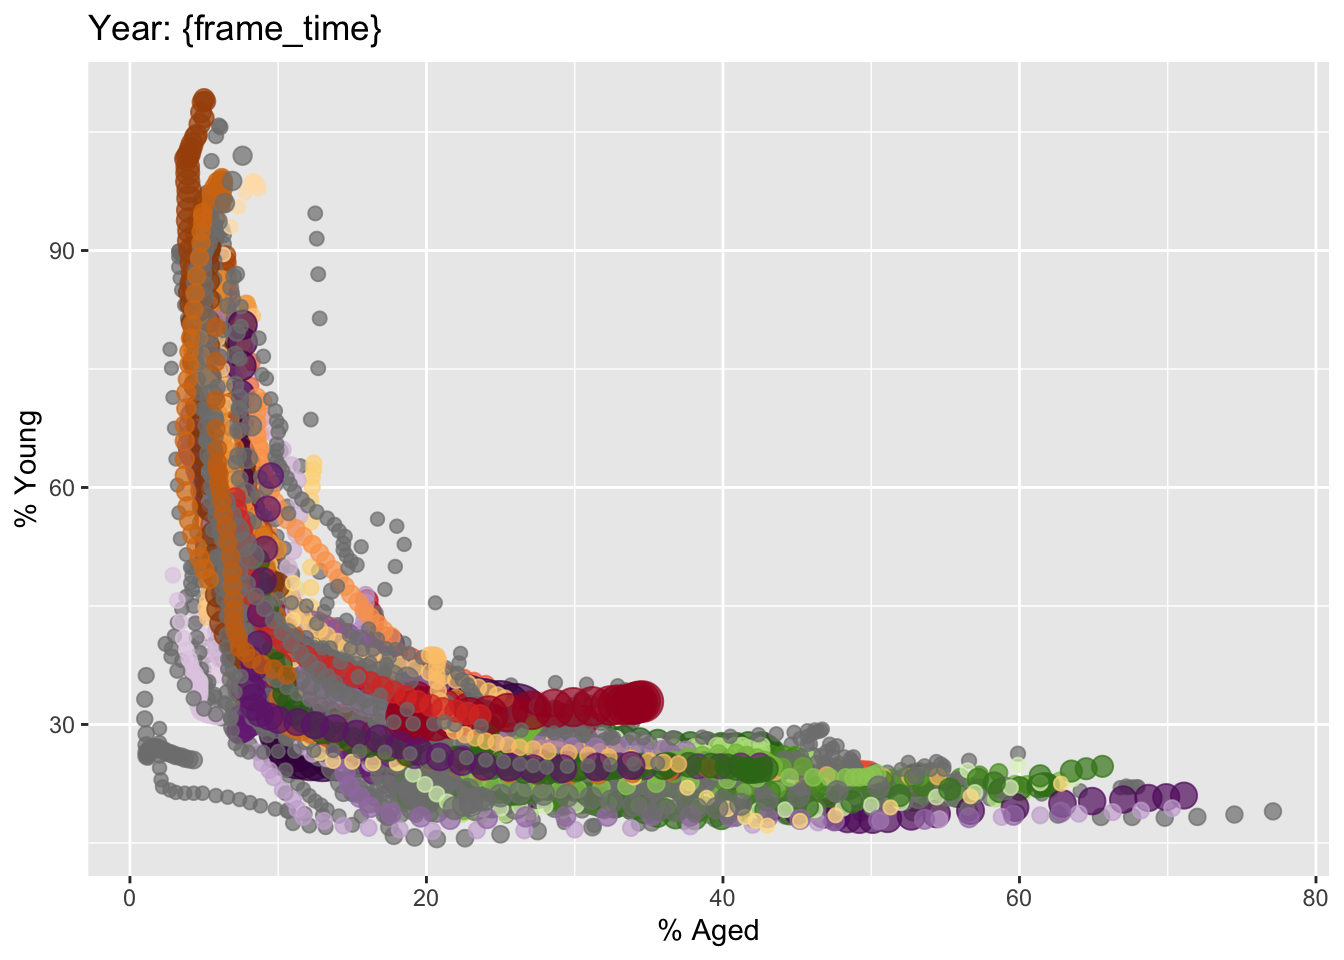
Animated Bubble Plot with gganimate
# Animated bubble plot with gganimate
ggplot(globalPop, aes(x = Old, y = Young,
size = Population,
colour = Country)) +
geom_point(alpha = 0.7, show.legend = FALSE) +
scale_colour_manual(values = country_colors) +
scale_size(range = c(2, 12)) +
labs(title = 'Year: {frame_time}',
x = '% Aged',
y = '% Young') +
transition_time(Year) +
ease_aes('linear')
Animated Bubble Plot with ggplotly()
# Create the ggplot object
p <- ggplot(globalPop, aes(x = Old, y = Young,
size = Population,
colour = Country,
frame = Year)) +
geom_point(alpha = 0.7) +
scale_colour_manual(values = country_colors) +
scale_size(range = c(2, 12)) +
labs(x = '% Aged', y = '% Young') +
theme(legend.position = 'none')
# Convert to plotly animation
ggplotly(p)Warning in p$x$data[firstFrame] <- p$x$frames[[1]]$data: number of items to
replace is not a multiple of replacement lengthAnimated Bubble Plot with plot_ly()
# Animated bubble plot using plot_ly
plot_ly(globalPop,
x = ~Old, y = ~Young,
size = ~Population,
color = ~Country,
frame = ~Year,
text = ~Country,
hoverinfo = "text",
type = 'scatter', mode = 'markers',
marker = list(sizemode = 'diameter',
sizeref = 2.0,
opacity = 0.7)) %>%
layout(title = 'Global Population Dynamics',
xaxis = list(title = "% Aged"),
yaxis = list(title = "% Young"),
showlegend = FALSE)Warning in RColorBrewer::brewer.pal(N, "Set2"): n too large, allowed maximum for palette Set2 is 8
Returning the palette you asked for with that many colors
Warning in RColorBrewer::brewer.pal(N, "Set2"): n too large, allowed maximum for palette Set2 is 8
Returning the palette you asked for with that many colorsWarning in p$x$data[firstFrame] <- p$x$frames[[1]]$data: number of items to
replace is not a multiple of replacement length